-
NVM Default Global Packages
Did you know that
nvmsupports a list of default global packages to include when installing a new node version?Default global packages from file while installing
If you have a list of default packages you want installed every time you install a new version we support that too. You can add anything npm would accept as a package argument on the command line.
 # $NVM_DIR/default-packages

 rimraf
 object-inspect@1.0.2
 stevemao/left-pad
Personally, I use this to make sure
gulp-cliis installed in new node versions. -
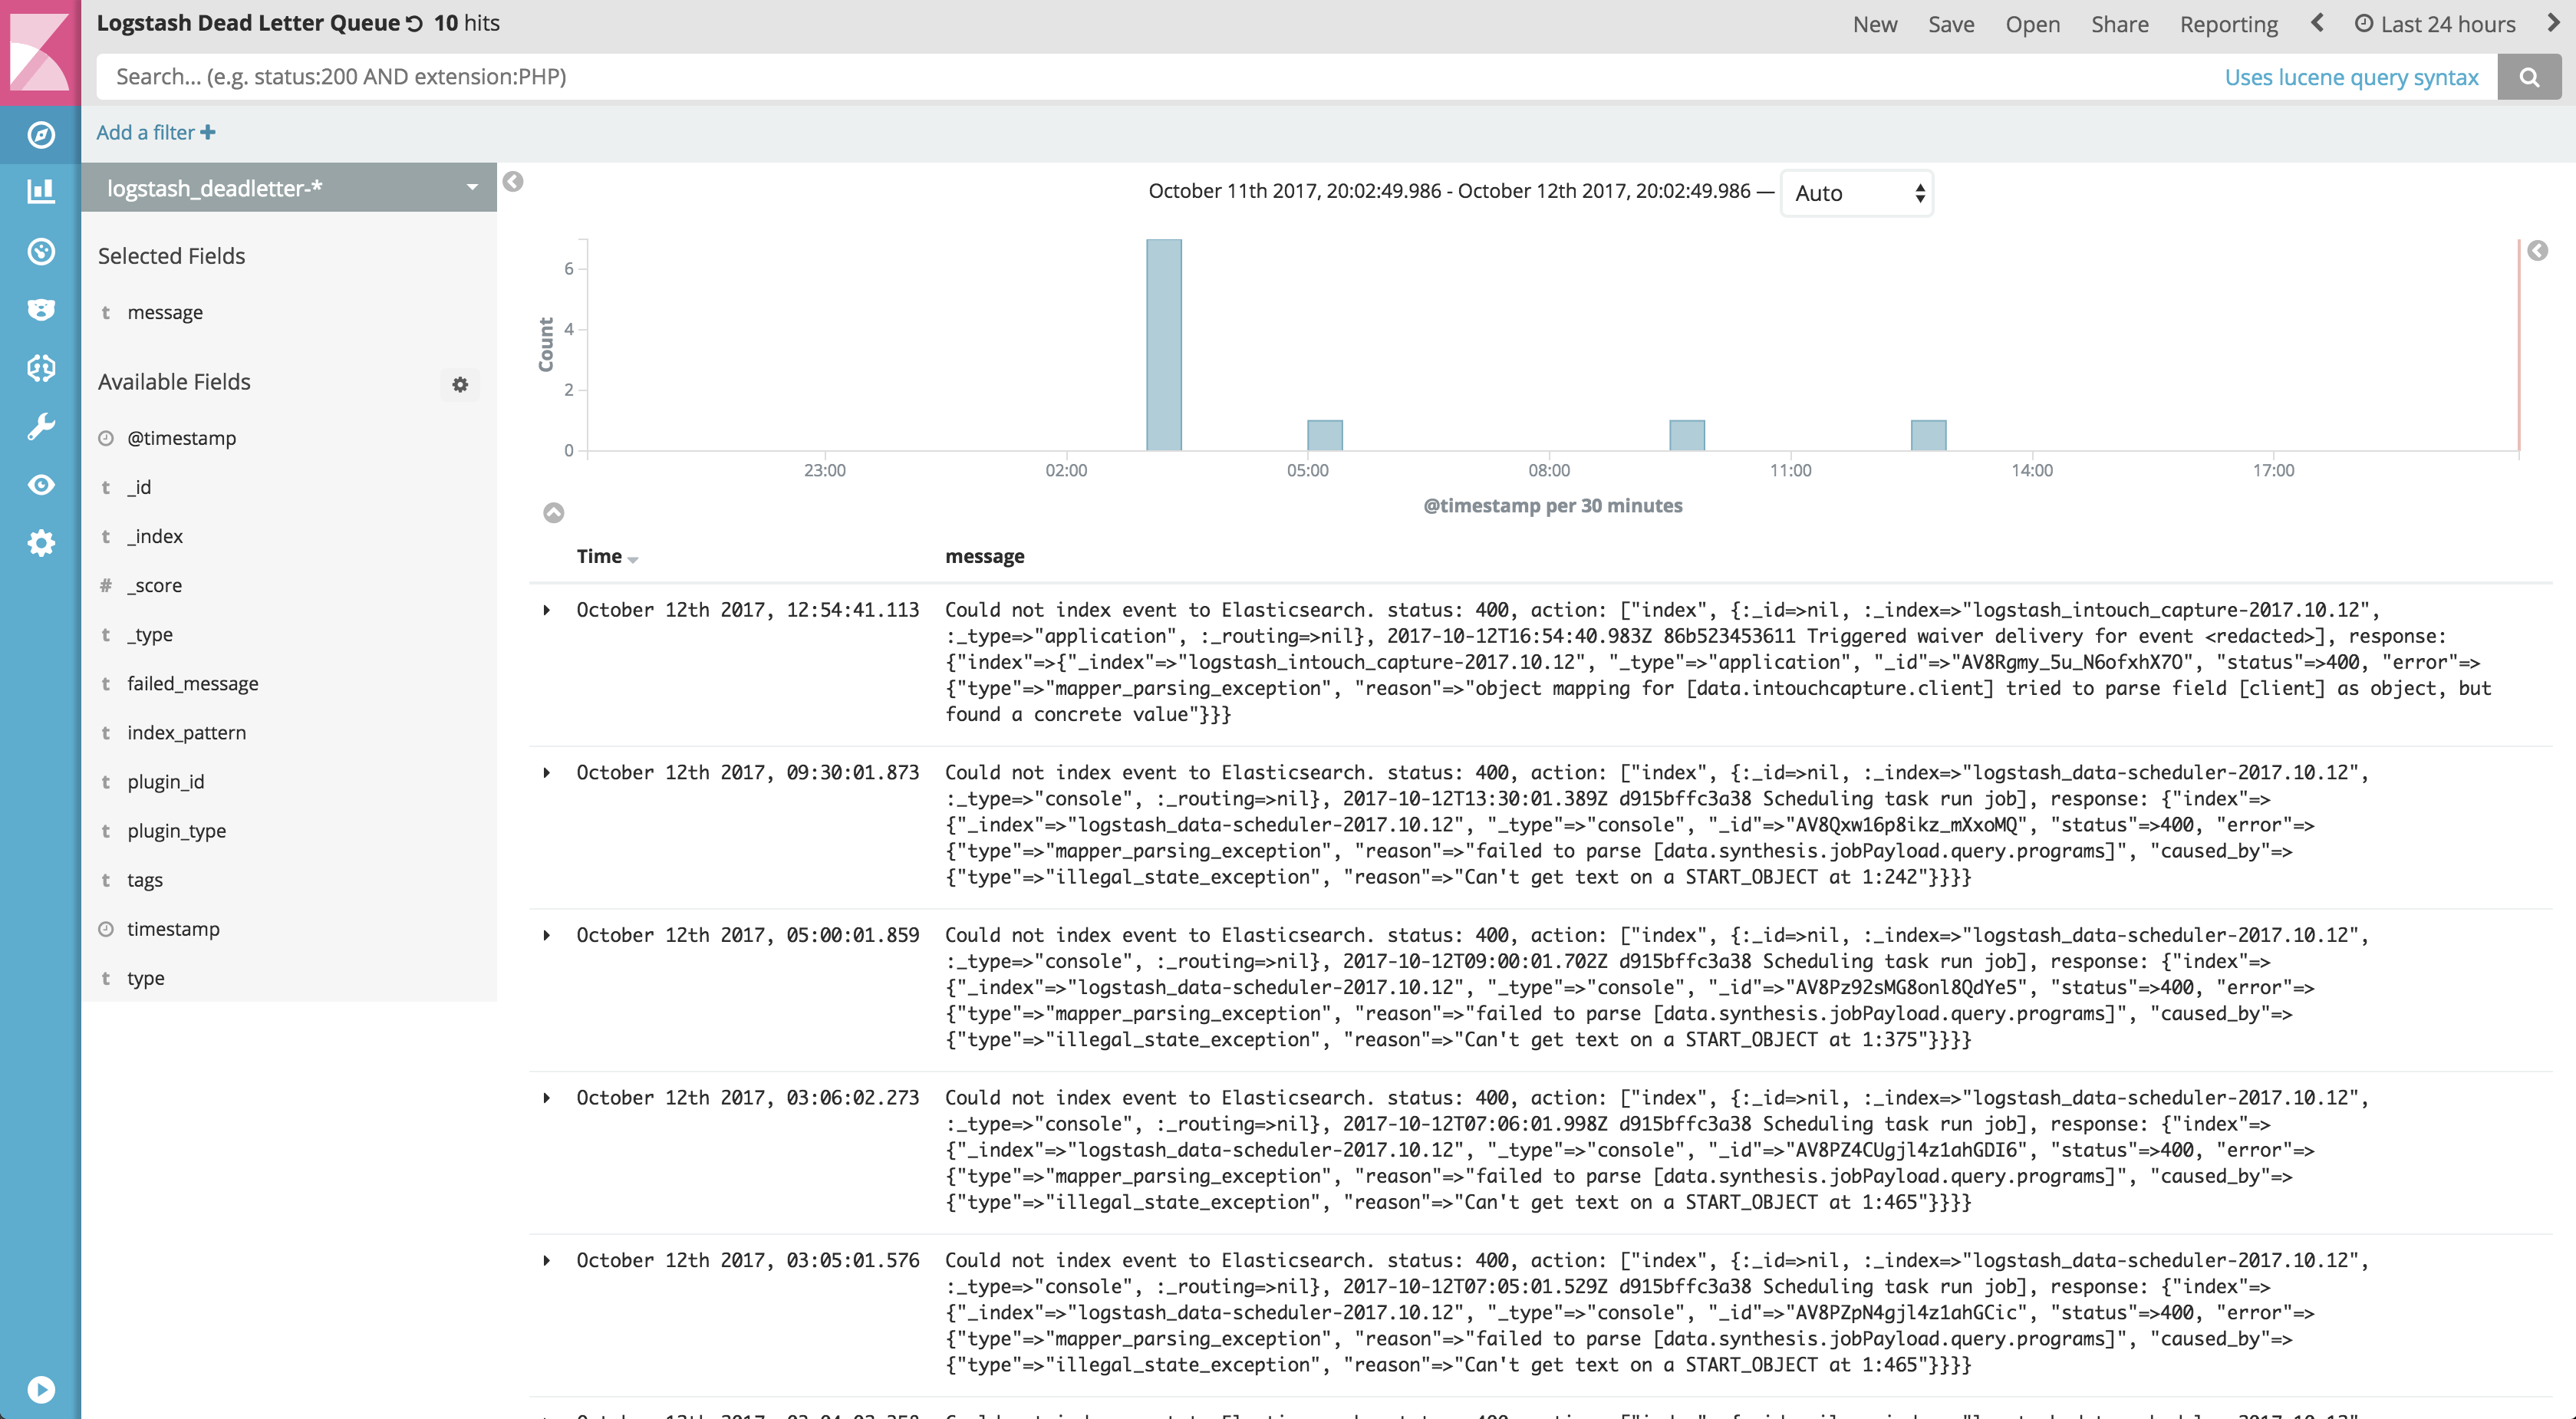
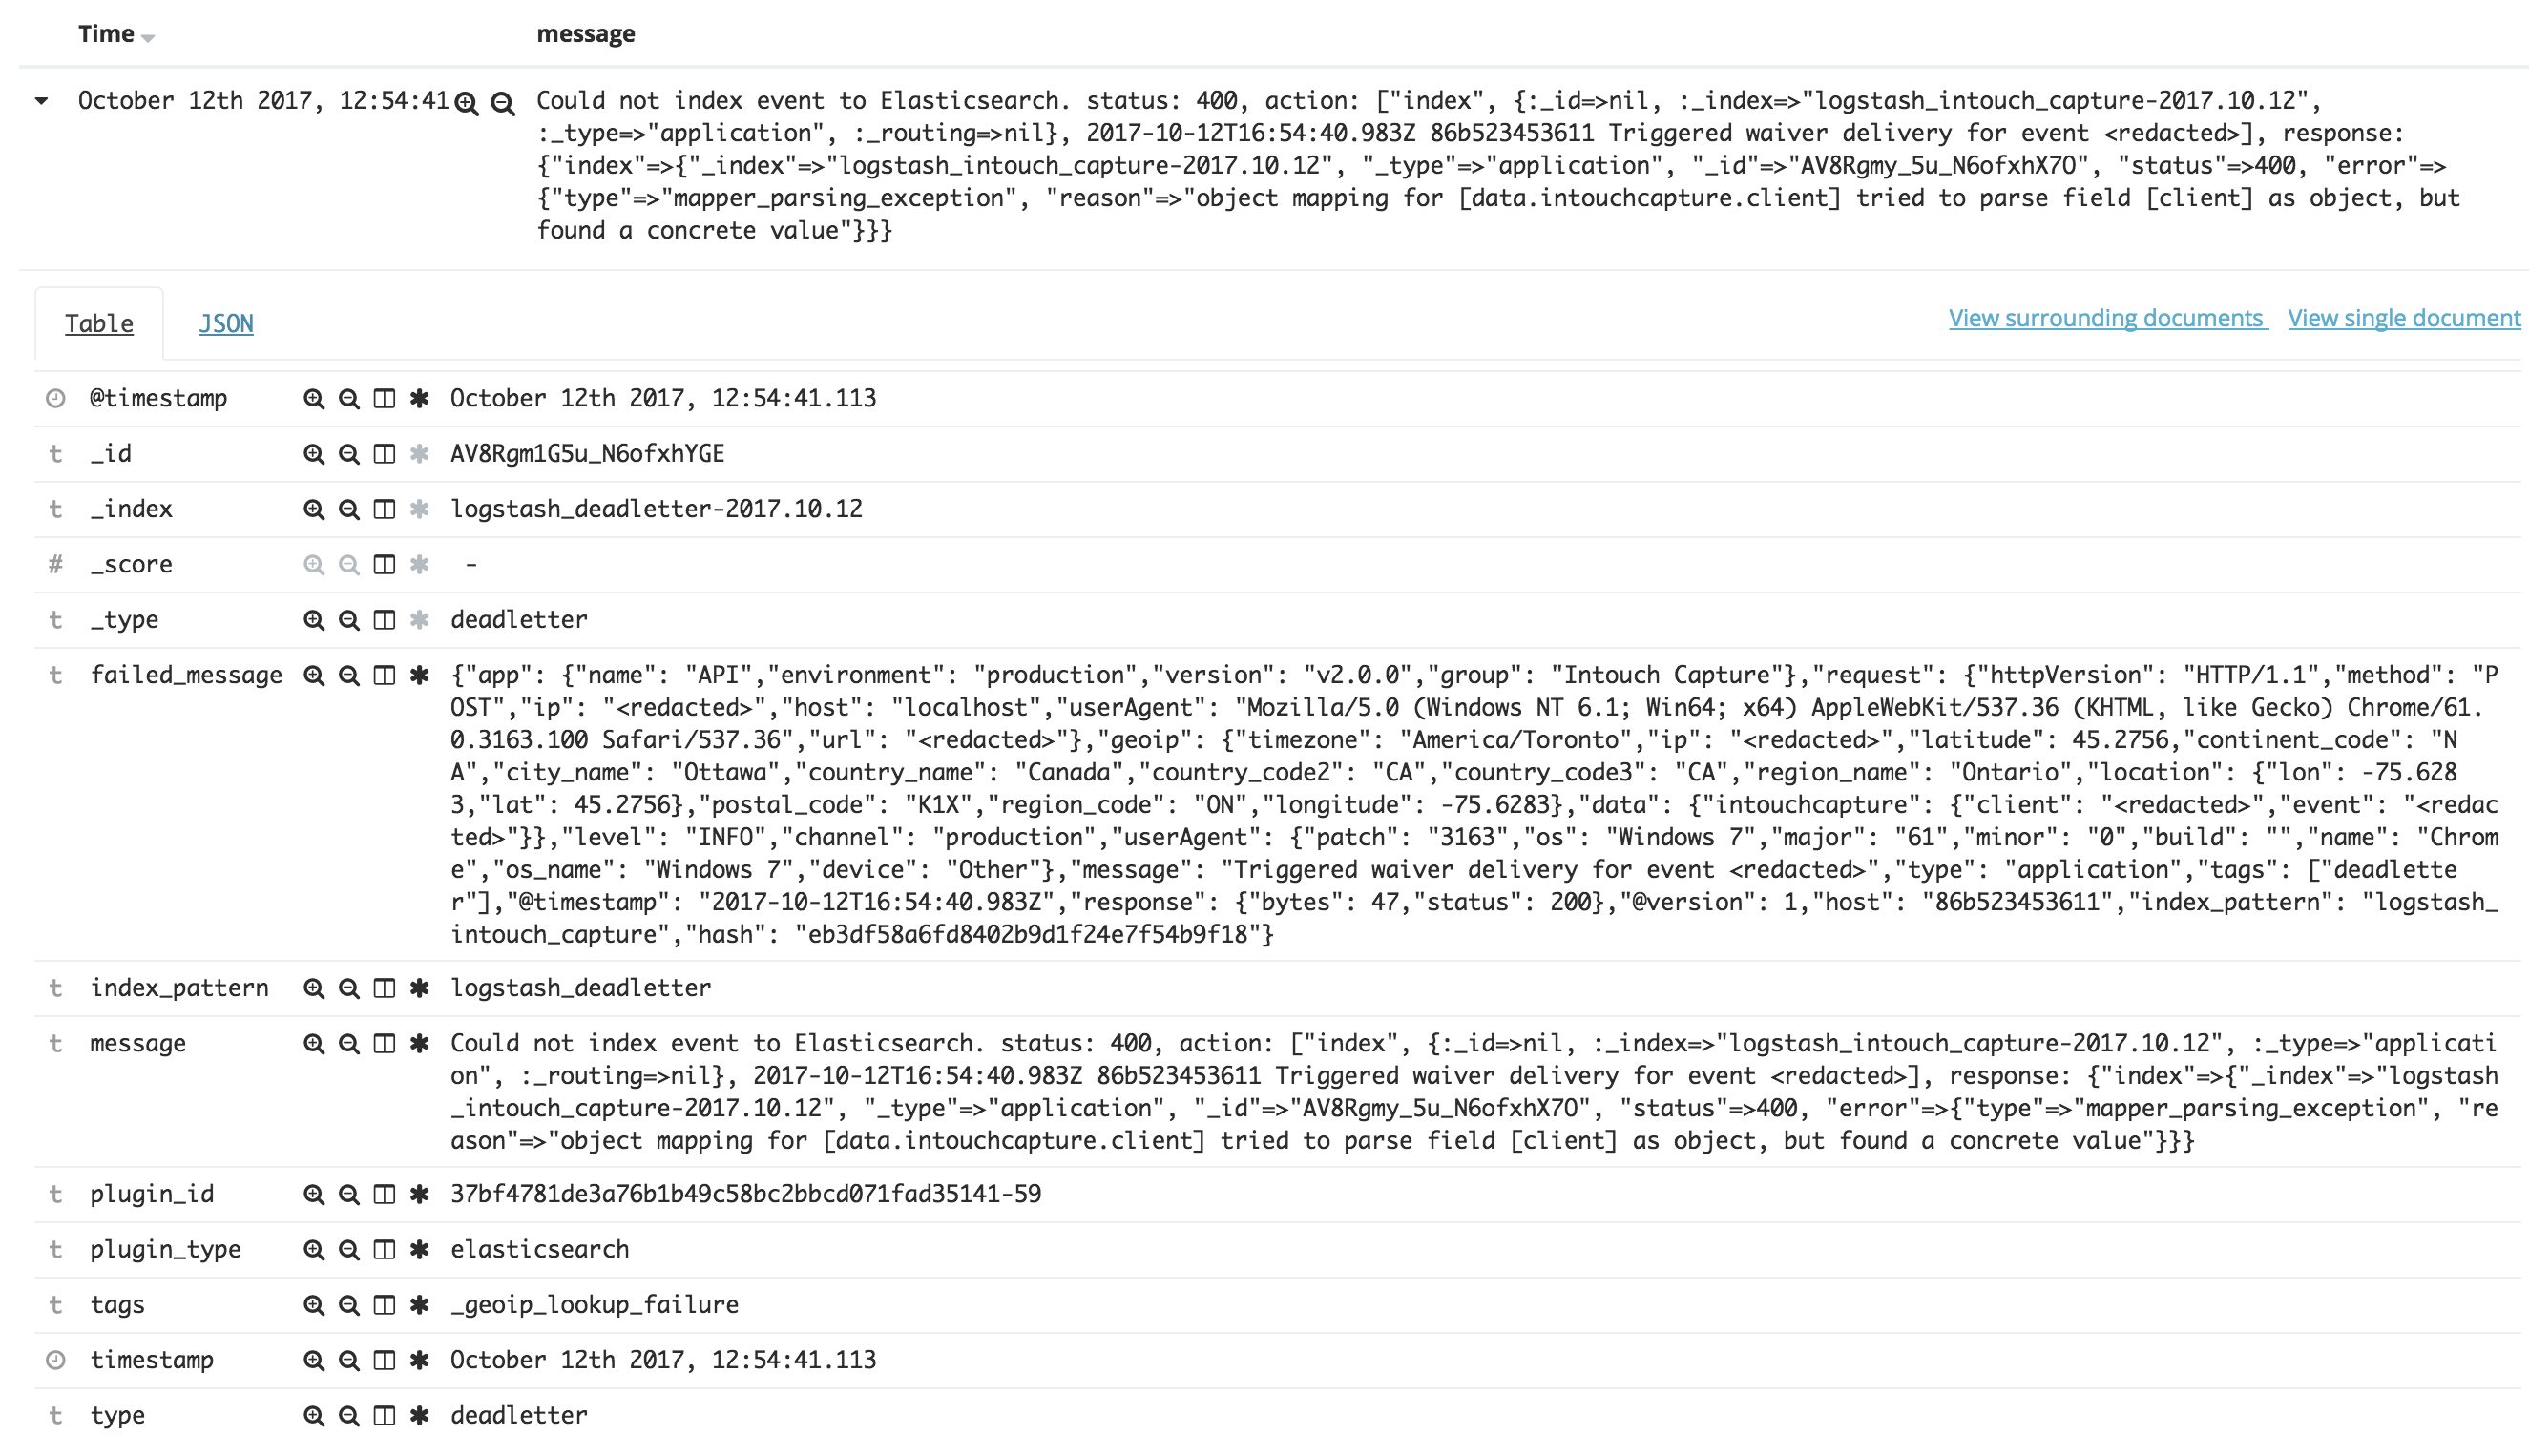
Viewing the Logstash Dead Letter Queue in Kibana
At Intouch Insight our logging infrastructure is our holy grail. The engineering team relies on it every day, so we need to keep it up to snuff. I was lucky enough to be able to update our ELK cluster this week to 5.6 - a huge upgrade from our previous stack running ES 2.3 and Kibana 4.
One of the features I was most looking forward to was the dead letter queue that was introduced in Logstash 5.5.
The Problem
The documentation surrounding the usage of the dead letter queue mostly revolves around re-processing rejected events. I wasn’t particularly interested in that use case; I just wanted to be able to easily see when events were rejected.
The Solution
1
2
3
4
5
6
7
8
9
10
11
12
13
14
15
16
17
18
19
20
21
22
23
24
25
26
27
28
29
30
31
32
33
34
35
36
37
38
39
40
41
input {
    dead_letter_queue {
        path => "/usr/share/logstash/data/dead_letter_queue"
    }
}

filter {
    # First, we must capture the entire event, and write it to a new
    # field; we'll call that field `failed_message`
    ruby {
        code => "event.set('failed_message', event.to_json())"
    }

    # Next, we prune every field off the event except for the one we've
    # just created. Note that this does not prune event metadata.
    prune {
        whitelist_names => [ "^failed_message$" ]
    }

    # Next, convert the metadata timestamp to one we can parse with a
    # date filter. Before conversion, this field is a Logstash::Timestamp.
    # http://www.rubydoc.info/gems/logstash-core/LogStash/Timestamp
    ruby {
        code => "event.set('timestamp', event.get('[@metadata][dead_letter_queue][entry_time]').toString())"
    }

    # Apply the date filter.
    date {
        match => [ "timestamp", "ISO8601" ]
    }

    # Pull useful information out of the event metadata provided by the dead
    # letter queue, and add it to the new event.
    mutate {
        add_field => {
            "message" => "%{[@metadata][dead_letter_queue][reason]}"
            "plugin_id" => "%{[@metadata][dead_letter_queue][plugin_id]}"
            "plugin_type" => "%{[@metadata][dead_letter_queue][plugin_type]}"
        }
    }
}
How it looks
Dead Letter Queue - Logs 
Dead Letter Queue - Detail 
Next steps
I’d love to rewrite this as a codec that could be applied to the input, but that’s currently not possible as the
dead_letter_queueinput plugin doesn’t make any calls to the codec specified in it’s config. -
AWS Aurora & CloudWatch Alarms
Today I learned an interesting lesson. If you’re using AWS Aurora, don’t set your alarms (CPU, memory, etc) on an individual instance. The reason? Aurora instances, by their very nature, are somewhat transient:
- If you have an issue with a given primary, Aurora may promote another instance to your
WRITERrole. - If you need to perform an in-place update, you can sometimes do so by creating a new set of instances, and promoting those manually.
In either case, you’ll either lose your alarms completely, if you forget to re-create them, or your alarms for your primary instance will no longer be on your primary.
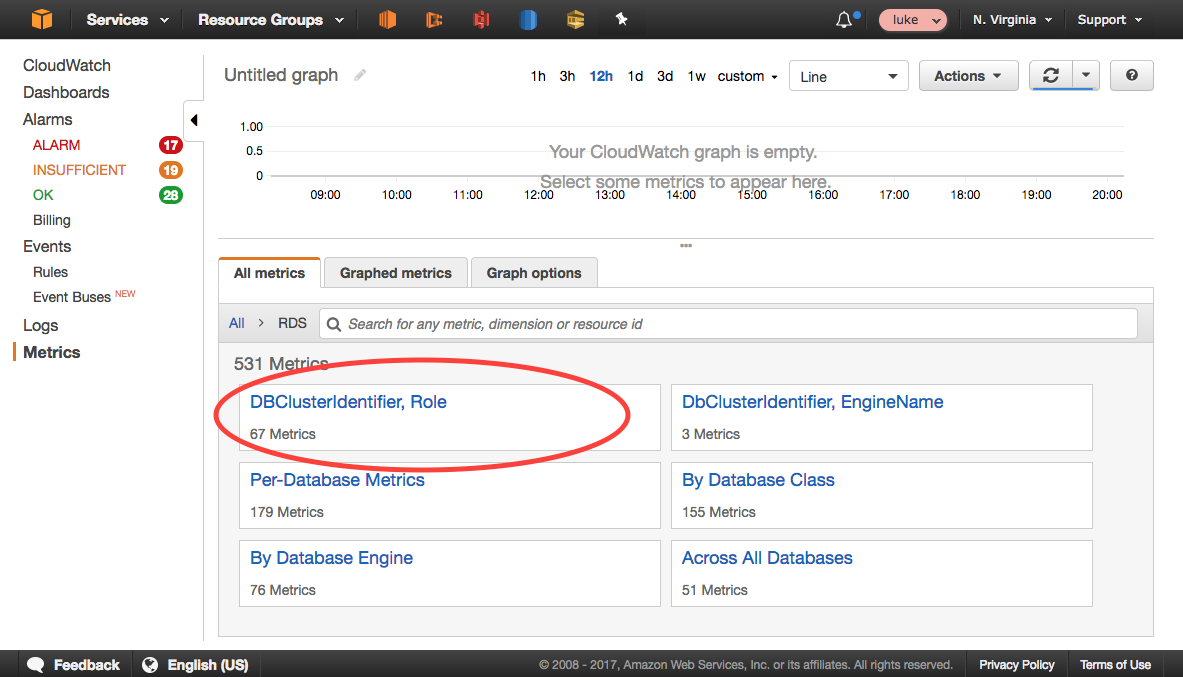
It turns out that the metrics Aurora publishes also include
DBClusterIdentifierandRoledimensions.If you choose that dimension group, then you can view metrics and set alarms based on the
WRITERorREADERroles, for whatever cluster you desire. This is much more fool-proof than setting alarms per-instance.Metrics by DBClusterIdentifier and Role 
- If you have an issue with a given primary, Aurora may promote another instance to your
-
PHPStorm Tips - Go to Implementation
Laravel is a great framework; it’s easy to use and extend, and makes liberal use of Interfaces so that you can write your own implementations and provide them to the IoC Container.
Unfortunately, the downside to this is navigability. Many times, your IDE detects that a variable has either been type hinted, or has code comments indicating that it is storing a particular Interface, rather than a concrete class, and this sometimes makes navigation difficult.
Allow me to introduce you to
Go to Implementation (CMD-OPT-B)in PHPStorm - just one additional key press away from the most commonly usedGo to Declaration (CMD-B)It’ll allow you to select a specific implementation of whatever abstract method you’ve got a reference to. -
Bash One-Liner: Retry Laravel Failed Jobs, Filtered by Date
We all have those moments when Queue jobs fail. Sometimes it’s a bad deploy, others it’s an upstream service that’s taken a poop. Sometimes, we need to retry failed jobs, but can’t just
artisan queue retry:all, because maybe we haven’t done a cleanup of failed jobs lately.Oops…
worker@5986f48e91d6:/var/www/app# php artisan queue:failed | grep -v 2017-08-17 +------+------------+--------------------------------------------------+-------------------------+---------------------+ | ID | Connection | Queue | Class | Failed At | +------+------------+--------------------------------------------------+-------------------------+---------------------+ | 3094 | sqs | https://sqs.us-east-1.amazonaws.com/123/my-queue | App\Jobs\MyImportantJob | 2017-08-17 21:14:07 | ... | 851 | sqs | https://sqs.us-east-1.amazonaws.com/123/my-queue | App\Jobs\MyImportantJob | 2017-08-17 03:35:08 | | 850 | sqs | https://sqs.us-east-1.amazonaws.com/123/my-queue | App\Jobs\MyImportantJob | 2017-07-28 11:35:08 | | 849 | sqs | https://sqs.us-east-1.amazonaws.com/123/my-queue | App\Jobs\MyImportantJob | 2017-07-28 11:27:09 | | 848 | sqs | https://sqs.us-east-1.amazonaws.com/123/my-queue | App\Jobs\MyImportantJob | 2017-07-28 11:26:37 | | 847 | sqs | https://sqs.us-east-1.amazonaws.com/123/my-queue | App\Jobs\MyImportantJob | 2017-07-28 11:20:38 | ... | 262 | sqs | https://sqs.us-east-1.amazonaws.com/123/my-queue | App\Jobs\MyImportantJob | 2017-03-21 10:33:19 | +------+------------+--------------------------------------------------+-------------------------+---------------------+ -
Finding Files in S3 (without a known prefix)
S3 is a fantastic storage service. We use it all over the place, but sometimes it can be hard to find what you’re looking for in buckets with massive data sets. Consider the following questions:
What happens when you know the file name, but perhaps not the full prefix (path) of the file?
I hit this in production today, which is the motive of the blog post. The next question is what I thought might be a useful example, when I wanted to extrapolate what I’d learned to other use cases.
How do you find files modified on specific dates, regardless of prefix?
-
NewRelic Instrumentation of the Elasticsearch PHP SDK
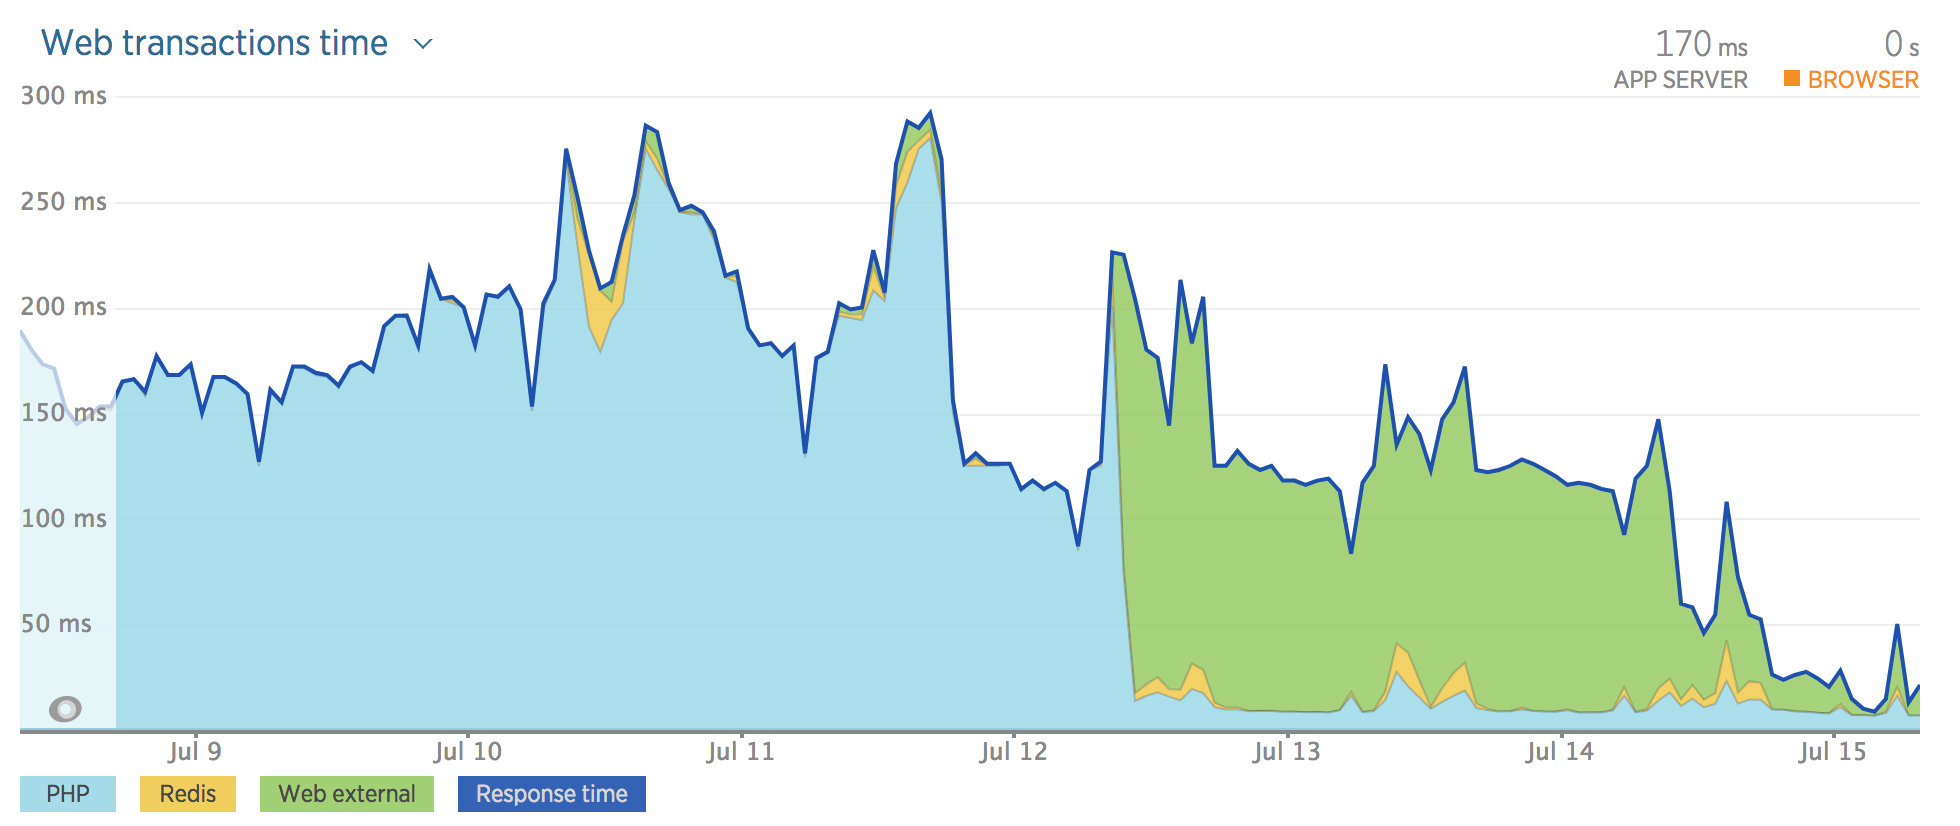
We run Elasticsearch in production, fronted by an API which abstracts away complex queries and presents our APIs which consume the data a consistent interface. It came to my attention recently that we had no visibility in NewRelic on external transaction time going to ES.
In a nutshell, the problem turned out to be that the elasticsearch-php-sdk uses RingPHP as a transport, which NewRelic doesn’t support.
I’ve written a RingPHP Guzzle Adapter which the user can pass to elasticsearch and quickly gain instrumentation.
$guzzle = new GuzzleHttp\Client();
$guzzleHandler  = new LukeWaite\RingPhpGuzzleHandler\GuzzleHandler($guzzle);

$client = Elasticsearch\ClientBuilder::create()
            ->setHandler($guzzleHandler)
            ->build();
NewRelic Before and After Instrumentation 
-
Laravel Caching for AWS Credentials
We’ve seen occasionally poor performance on the AWS EC2 Metadata API when using IAM roles at Intouch which got me thinking. Why does the
aws-pdp-sdkneed to hit the EC2 Metadata API during every request? Well, it turns out, it’s simple. If you don’t explicitly give the sdk a cache interface, then it won’t use one!I’ve just published the initial release of my laravel-aws-cache-adapter plugin on packagist.
-
AWS Batch as a Laravel Queue - Stable Release
Following up my previous post about the release of my laravel-queue-aws-batch plugin, I am pleased to announce that I have tagged two stable versions for release.
-
AWS Batch as a Laravel Queue
We use Laravel for all of our APIs at Intouch Insight, so when AWS Batch was released, I started wondering about backing our Laravel Queues with AWS Batch. This seemed like the perfect opportunity to give back, since I’m sure others are looking at Batch with the same interest that I am. A few evenings of playing around, and here we are.
-
GitLab, NPM, and SSHd MaxStartups
Intermittent issues are every developer’s best friend. Recently we started hitting an error during the
npm installphase of our CI and CD jenkins jobs. Here’s the error:npm ERR! git fetch -a origin (ssh://[email protected]/group/project.git) ssh_exchange_identification: read: Connection reset by peer npm ERR! git fetch -a origin (ssh://[email protected]/group/project.git) fatal: Could not read from remote repository. npm ERR! git fetch -a origin (ssh://[email protected]/group/project.git) npm ERR! git fetch -a origin (ssh://[email protected]/group/project.git) Please make sure you have the correct access rights npm ERR! git fetch -a origin (ssh://[email protected]/group/project.git) and the repository exists. npm ERR! Linux 3.13.0-54-generic npm ERR! argv "/usr/bin/node" "/usr/bin/npm" "install" npm ERR! node v0.12.4 npm ERR! npm v2.10.1 npm ERR! code 128 npm ERR! Command failed: git fetch -a origin npm ERR! ssh_exchange_identification: read: Connection reset by peer npm ERR! fatal: Could not read from remote repository. npm ERR! npm ERR! Please make sure you have the correct access rights npm ERR! and the repository exists. npm ERR! npm ERR! npm ERR! If you need help, you may report this error at: npm ERR! <https://github.com/npm/npm/issues>In our particular use case, we’d just passed the threshold of having more than 10 internally sourced NPM dependencies, being sourced by tag directly from our GitLab server.
The solution is updating quite a simple SSH setting;
MaxStartups. Here’s the man page entry from sshd_config.Specifies the maximum number of concurrent unauthenticated connections to the SSH daemon. Additional connections will be dropped until authentication succeeds or the LoginGraceTime expires for a connection. The default is 10.
Yes - sshd will throttle your concurrent connections while they authenticate. Increasing
MaxStartupscaused our npm installation woes to disappear from our CI environment. Huzzah! -
AWS Lambda and ELK
I’ve been using the ELK stack for over three years. It’s a tool that is used daily at work, so it’s little surprise that when In-Touch Insight Systems went down the AWS Lambda road for one of our newest projects, I wasn’t happy using the default CloudWatch Logs UI.
CloudWatch Logs with Lambda Output 
-
Improving OpsWorks Boot Times
The Problem
Initial setup of OpsWorks instances takes between 15 and 25 minutes depending on the complexity of your chef recipes.
Why?
The OpsWorks startup process injects a sequence of updates and package installations via the instance userdata before setup can run. To make matters worse, the default Ubuntu 14.04 AMI provided by AWS (at the time of writing) over six months old! YMMV but I experienced a 11 minute speedup simply in “time to
running_setup” by introducing a simple custom AMI.